Who do the working classes vote for?
Between 1987 and the most recent election in 2017, voting habits for people on low-incomes have changed dramatically.
While people on low incomes have historically been more likely to vote Labour than Conservative, party loyalty is no longer guaranteed.
A new report from JRF states that: “Low-income voters are ‘up for grabs’ like never before”. Between 2010 and 2017, over 50% of low income voters changed who they voted for or if they voted at all.
Timeline
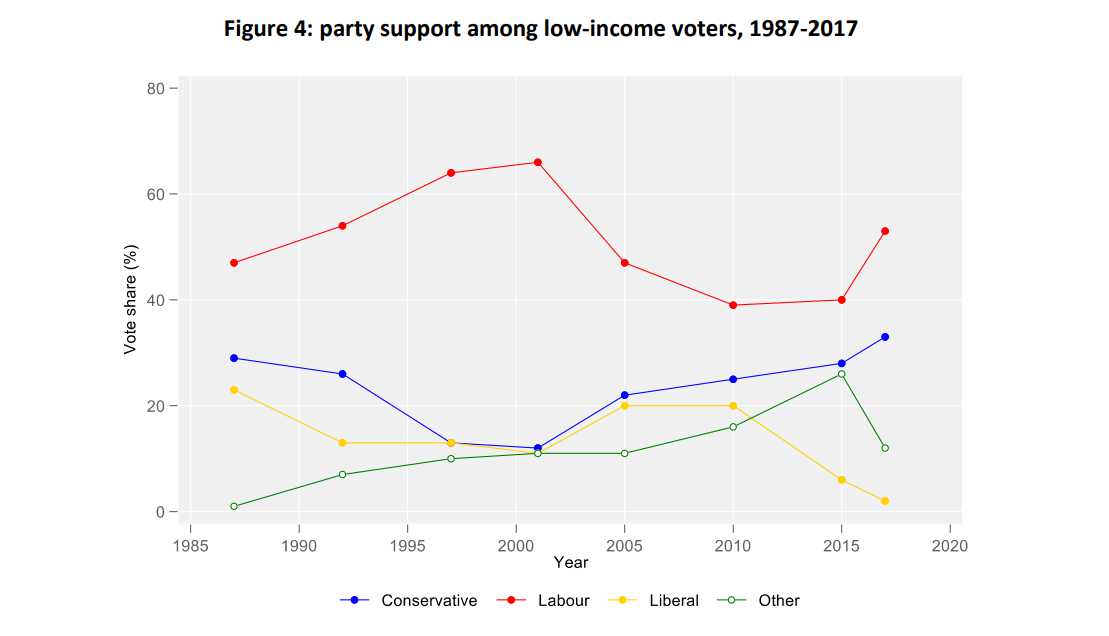
- 1987: 47% of low income voters supported Labour, while 29% voted Conservative
- 1992: 54% of low income voters supported Labour, while 26% voted Conservative
- 1997: 64% of low income voters supported Labour, while 13% voted Conservative
- 2001: 66% of low income voters supported Labour, while 12% voted Conservative
- 2005: 47% of low income voters supported Labour, while 22% voted Conservative
- 2010: 39% of low income voters supported Labour, while 25% voted Conservative
- 2015: 40% of low income voters supported Labour, while 28% voted Conservative
- 2017: 53% of low income voters supported Labour, while 33% voted Conservative
Votes for the Liberal Democrats fell from 23% in 1987 to 2% in 2017.